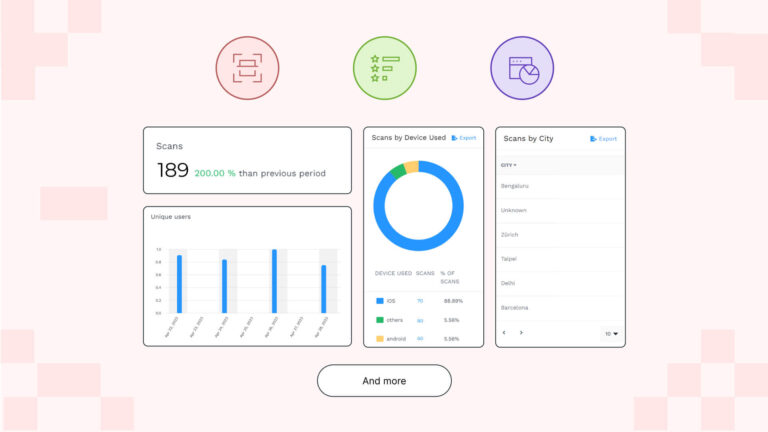
One of the biggest benefits of switching from paper to digital business cards is that you can monitor client engagement and your team’s performance in real-time with card-scan analytics.
Analyzing digital business card engagement metrics, such as views, unique users reached, contact saves, etc., in real-time can:
- Give you insights into your team’s performance
- Help you analyze how and when your recipients interact with the cards
- Let you identify gaps in your networking efforts
- Help you make data-driven decisions to optimize your networking strategies
Read on to learn the metrics you can track through your digital business cards and how they can help you make data-driven networking decisions.
Table of Contents
- How to track digital business card engagement metrics
- How to track engagement metrics for individual cards
- Conduct measurable and ROI-driven networking with Uniqode
- Frequently asked questions
Tracking your digital business card engagement—how to do it and what metrics you can track
Once you have created and shared your digital business cards with your clients, you can track the number of card scan metrics through Uniqode’s digital business card solution.
To view your card scan data, follow these steps:
- Log in to your Uniqode account.
- Select “Analytics” from the left sidebar. You can now view the analytics dashboard of your digital business cards.
- From this dashboard, begin by setting the timeline from the dropdown menu in the top right corner. Select the timeline based on your requirement from pre-set options or choose “Custom”.
- Next, choose the cards you want to track. You can either track all cards created by you or your entire organization’s cards (if you are an admin).
Your analytics dashboard is now ready for tracking. You can track your cards’ performance via the following seven engagement metrics:
1. Card views: The total number of views your card has received
“Card views” represent the overall number of scans of all the digital business cards of your team accumulated during your chosen timeline.
If you’re a manager, you can compare the most recent card views data with the same data from another time frame—to identify an increase or decrease in the number of card views.
Let’s consider you notice an increase in card views, but the total number of deals your team members closed remains stagnant.
This dissonance in views and conversion could indicate a need to optimize your conversion funnel or review the strategy to capitalize on the surge in card views.
This case mentioned above is just one use case for tracking total card views to your benefit. The potential is vast.
Added tips:
1. There’s an option (on the top right corner of this metric’s box) to view the data in either bar graphs or line graphs—whichever is your preference.
2. Click the “Export” icon to download the “Card views” data as a .csv file.
2. Contact saves: The total number of times someone saved your contact information

A potential client saving your contact information signifies high intent and could mean they are interested in your service/product.
By tracking the recipients who saved your contact details, you can find out if your strategy is on the right track and further enhance it accordingly.
Added tips:
1. You can change the graph format—from a line or vice versa — by clicking on the icons at the top-right corner of this metric’s box.
2. Click the “Export” icon to download your “Contact saves” data as a .csv file.
3. Unique users: The total number of unique recipients your cards reached
“Unique users” represents the number of unique leads reached via all your cards.
By tracking unique users, you will clearly know how many potential clients you have communicated with.
Please note that “Unique users” is distinct from “Card views.”
“Unique users” represents the number of unique interactions, while “Card views” shows total scans—including repetitive scans by a single client.
Your clients can scan your card multiple times, either by mistake or due to some technical glitch in their device or network. To see an accurate count of the unique leads your cards have reached, focus solely on “Unique users”.
Added tips:
1. You can change the graph format to a bar chart by clicking on the icons at the top-right corner of this metric’s box.
2. Click the “Export” icon to download your “Unique users” data.
4. Card views by device: Details about the devices used to view your cards
The “Card views by device” metric shows the total number of views your cards received per mobile OS—iOS, Android, Mac, and Windows.
This metric lets you identify the device OS that is most used by your potential clients so you can ensure your card is optimized for every device.
Added tips:
1. This data and the scan percentage by the device will also be available in a tabular format below the circle graph.
2. Click the “Export” icon to export the data from this metric to a .csv file.
5. Card views by time: The exact hours of the day users are viewing your cards

“Card views by time” lets you track the time of the day (per the selected time) when users are viewing your cards.
This data point helps you identify the time of the day you get the maximum number of card scans.
Let’s say you have been getting the highest number of scans between 11 AM and 12 PM. This could indicate that your potential clients engage the most during this time of the day.
Therefore, you can schedule meetings with your prospects around this time to maximize the ROI of your networking efforts.
Added tip: Hover over the individual boxes next to a specific hour to see the exact number of scans during that hour per day of the week.
6. Card views by city: The specific cities where recipients are viewing your cards
The “Card views by city” metric lets you track the specific cities where your digital business cards were scanned.
If your networking efforts span multiple states and cities, analyzing this metric can help you precisely target your networking efforts by location.
For instance, you observe an increase in card views from Chicago and Washington DC on the East Coast and Los Angeles on the West.
This spike in card views could indicate more demand for your product/service in those cities.
You can focus more on your networking efforts in those cities that draw the maximum views and capitalize on this observation.
Added tips:
1. You can track the city, state/province, country, card views, contact saves, and each specific city’s percentage of views from this metric.
2. Click the “Export” icon to export this data to a .csv file.
7. Card views by location: The total number of card views from a specific location within a city
“Card views by location” lets you track the exact geographic location from where your card was viewed.
Let’s say you identified Chicago as the city with the maximum number of card scans through the metric “Card views by city.”
Now, with the metric ”Card views by location,” you can further narrow down the search and find the exact geographical locations within Chicago from where the scans were made.
This feature uses your recipient’s device’s IP address to track the location and is permission-based.
Pro tip: You can begin surveying the exact geographical locations where your cards were viewed using the dynamic map provided.

How to track engagement metrics for individual cards
If you want to track the engagement metrics for individual cards (not for your entire team), you can do so from the “My Cards” dashboard. Follow the steps below:

1. Select “My Cards” (under “Digital Business Cards”) on the left-hand sidebar to access the list of all the digital business cards you have created.
2. Choose the specific card you want to track by clicking the “Analytics” icon on the right-hand side of the entry. You will be taken to the analytics dashboard of that specific card.
3. Select the time for which you wish to track engagement metrics.
You can track individual card metrics such as card views, contact saves, unique users, and card views by time, device, city, and location.
Note: If you want to track an individual card’s engagement metrics, the steps are the same as those used to track overall engagement metrics.
Pro-tip for admins/managers
As a manager/admin, you can get a birds-eye view of your teams’ networking performance by following the simple steps below: 
1. After logging into your Uniqode account, click on “Overview,” located at the top-left of the sidebar.
2. You will be taken to a dashboard containing the overview of all the digital business cards you’ve created.
3. Find “Digital Business Cards,” where you can track the number of total cards, overall views, and contact saves.
4. Under “Most Viewed Cards,” you can track all the individual card views—from most viewed to least viewed.
5. Under the “Most Saved Cards” section, you can track the number of cards saved for individual cards in descending order (most to least saved).
Following these steps, you will get an idea of whose card is performing well and whose is underperforming. By combining the data mentioned above with the “Analytics” dashboard, you can draw actionable conclusions to optimize your team’s networking efforts.
Conduct measurable and ROI-driven networking with Uniqode
There you have it—Uniqode makes it extremely easy to track and analyze digital business card engagement.
The digital business card solution fetches accurate, understandable, and real-time data to help you align your efforts with the demands of modern networking and maximize ROI.
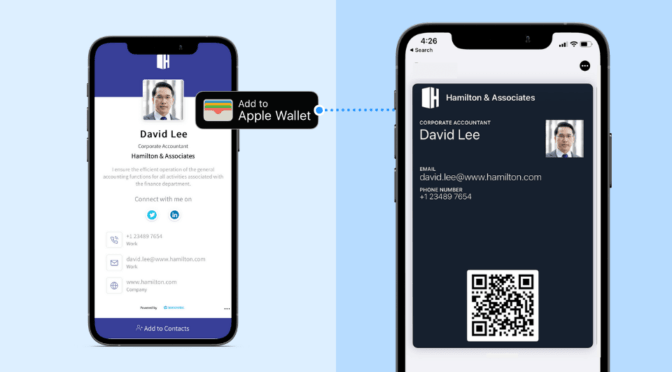
Furthermore, Uniqode allows you to create highly customizable digital business cards and share them across channels such as Apple or Google Wallet, social media, email signature, etc.
You can capture your client’s contact information directly from your digital business card by enabling lead data collection on Uniqode’s dashboard.
With GDPR and SOC 2 Type 2 compliance, SSO login, and robust data encryption, the platform is the most secure digital business card solution in the market.
The best part? You can access all of these functionalities without downloading any additional apps.
Further reading: The 6 best digital business card solutions available today

Frequently asked questions
1. How do I track my digital business card views?
Here’s how to track your digital business card views with Uniqode:
- Log in to your Uniqode account.
- Select “Analytics” on the left panel to view the analytics dashboard.
- Next, set the preferred time and category of the card views from the dropdown at the top left corner.
- Examine “Card views” at the top left corner of the dashboard. This shows the total number of views your cards have accumulated during the selected period and the comparison percentage of the previous period.
- Scroll down further for a detailed analysis of “Card views”.
- Using the graph provided, you can ascertain the number of card views you received on each day of your chosen time..
- On the right-hand side of the graph, find “CARD VIEWS” of the selected period, the card views of the “PREVIOUS PERIOD” (per the selected period), along with the comparison percentage.
- Click on the “Export” icon and download the data.
2. How do digital business cards work?
Digital business cards work in a simple process. It starts with creating the business card, then sharing it, and finally ends with your recipient scanning it and interacting with your card.
Check out this resource to learn more about how digital business cards work.
3. How are digital business cards shared?
Digital business cards can be shared:
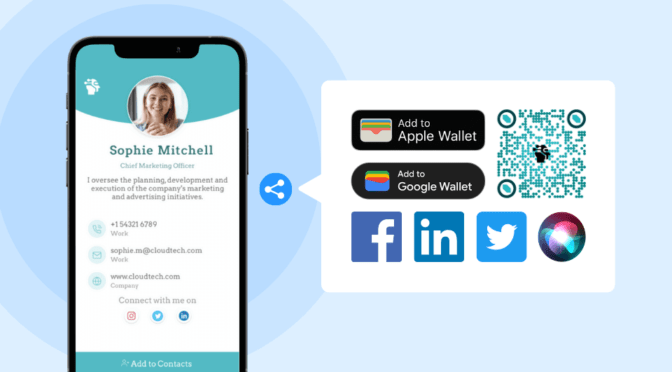
- By adding your card to Apple Wallet or Google Wallet then sharing it as a wallet pass
- As a QR Code in email signatures or social media
- As a URL
You can check out this resource to learn more about distributing and promoting digital business cards.
4. Which are the top digital business card solutions?
After conducting thorough research based on factors such as ease of use, design capabilities, shareability, security, user interface, analytics, integrations, and bulk creation; we’ve shortlisted the top 5 digital business card solutions.
- Uniqode
- HiHello
- Knowee
- Blinq
- Haystack
Find out more about the features and capabilities of each solution on our resource covering the 5 best digital business card solutions available today.


