If you plan to add a QR Code to your packaging or launch a QR Code campaign for safe menus, you are a part of the 28 million-dollar club that has already done that. If you do it the way 95% of them do it, the chances of ending up with a sub-optimal QR campaign are high.
Want to be in the top 5% that truly nail their QR Code campaigns? This article is your guide.
Using insights from 204+ million QR Code scans globally, we’ll help you:
- Define what a successful QR Code campaign looks like
- Identify metrics that matter
- Benchmark your campaigns against industry standards
Before you dive in, learn more about trackable QR Codes.
QR Code performance glossary
While most terms in online marketing have overlapping meanings, having a glossary of terms specific to QR Codes might help you define the metrics you need to watch and how they are commonly calculated (thank us later!).
1. Scan-through rate (STR)
✍️Definition: The percentage of people who scanned the QR Code compared to the total number of people who saw it (impressions).
⚡Importance: Reflects campaign’s reach and audience size.
💡Example: A QR Code is placed on a webpage or an email at a busy mall.
- Total impressions (people who viewed a digitally displayed QR Code): 10,000
- Number of scans: 500
STR = (500 / 10,000) × 100 = 5%
In the above example, a 5% STR means that out of every 100 people who saw the QR Code, five scanned it. This indicates moderate effectiveness and may prompt design, CTA, or placement adjustments to boost performance.
2. Unique scans
✍️ Definition: The count of individual devices that scanned the QR Code, excluding repeated scans by the same user.
⚡Importance: Helps gauge the reach of your campaign.
💡 Example:
- Total scans: 2,000; Unique devices: 1,500.
- 1,500 unique scans show how many different people engaged.
3. Repeat scans
✍️ Definition: The number of times the same user scanned the QR Code multiple times.
⚡ Importance: Indicates effectiveness of the landing page content.
💡 Example:
- A customer scans a QR Code on a product label twice to revisit product details.
- Repeat scans = 2.
4. Time of day analytics
✍️ Definition: Tracks when QR Codes are scanned, broken down by time segments.
⚡ Importance: Helps identify peak engagement hours to optimize campaign timing.
💡 Example:
- A restaurant QR Code receives 80% of scans between 6 PM and 9 PM.
- The ideal time to target customers is during dinner hours.
5. Geolocation data
✍️ Definition: Tracks the geographical location of the users scanning the QR code.
⚡ Importance: Provides insights into regional engagement and helps refine localized marketing efforts.
💡 Example:
- A global brand’s QR Code campaign shows 70% scans from the US and 30% from Europe.
- Suggests where to focus marketing efforts.
6. Device type
✍️ Definition: Identifies whether the QR Code was scanned using an Android, iOS, or other device.
⚡ Importance: Enables optimization for platform-specific landing pages.
💡 Example:
- 60% of scans come from iPhones, prompting a focus on iOS-specific app features.
7. Conversion rate
✍️ Definition: The percentage of users who complete the desired action (e.g., sign-ups, purchases) after scanning the QR Code.
⚡ Importance: Measures the effectiveness of your landing page and overall campaign.
💡 Example:
- 500 scans lead to 50 purchases.
- Conversion rate = (50 / 500) × 100 = 10%.
8. Engagement rate
✍️ Definition: The percentage of users interacting with the landing page (e.g., click links, play videos) after scanning the QR Code.
⚡ Importance: Shows how engaging the content is post-scan.
💡 Example:
- Of 1,000 scans, 600 users interact with the landing page.
- Engagement rate = (600 / 1,000) × 100 = 60%.
9. Bounce rate
✍️ Definition: The percentage of users who scan the QR Code but leave the landing page without taking any action.
⚡ Importance: A high bounce rate indicates a disconnect between user expectations and the landing page content.
💡 Example:
- Of 200 scans, 150 users leave immediately.
- Bounce rate = (150 / 200) × 100 = 75%.
10. Lifetime scans
✍️ Definition: The total number of scans a QR Code receives over its lifespan.
⚡ Importance: It measures the long-term impact of the campaign.
💡 Example:
- A QR Code on product packaging is scanned 5,000 times in six months.
- Lifetime scans = 5,000.
11. Campaign ROI (return on investment)
✍️ Definition: Measures the revenue generated by the QR Code campaign relative to the cost.
⚡ Importance: Determines the financial success of the campaign.
💡 Example:
- Revenue: $10,000; Campaign cost: $2,000.
- ROI = (($10,000 – $2,000) / $2,000) × 100 = 400%.
12. QR Code retention rate
✍️ Definition: The percentage of users who return to interact with your QR Code after an initial scan.
⚡ Importance: Reflects the ongoing interest in the content or product.
💡 Example:
- 300 users scanned again out of 1,000 initial scans.
- Retention rate = (300 / 1,000) × 100 = 30%.
Keep these QR Code metrics handy. Download your free copy now and unlock the secrets to creating high-performing QR Code campaigns!
Discover how to:
✅ Increase scan-through rates for maximum reach.
✅ Track unique scans and engagement rates to fine-tune campaigns.
✅ Measure ROI and retention rates for long-term impact.
Performance doesn’t exist in a vaccum. When and why people scan matters as much as how many do. Seasonal retail moments make this especially clear. Halloween QR Code campaigns consistently show that engagement often begins weeks before peak shopping, rewarding brands that launch early instead of waiting for the calendar to catch up.
Where do QR Codes fit into your marketing strategy?
As marketers, we struggle to define our campaigns’ marketing mix.
What percentage of your budget should be prescribed for Google display ads vs. QR Codes? And what kind of returns can you expect from these channels?
I did a quick benchmarking for you to help you get a fix on your marketing mix:
I did a quick benchmarking for you to help you get a fix on your marketing mix:
| Marketing channel | CTR benchmark | Source |
| QR Code campaigns | 12.80% | (Uniqode database) |
| Google display ads | 5.06% | (Instapage) |
| Email marketing | 2.60% | (Campaign Monitor) |
| Facebook ads | 0.90% | (Wordstream) |
| Instagram feed ads | 0.22% | (Smart insights) |
QR Code campaigns: Industry-wide benchmarks
Uniqode powers millions of QR Code scans worldwide, and our analysts are dissecting them in multiple ways.
💡Fun Fact:
95% business leaders recognize QR COdes’ value for first party data collection.
Explore more fascinating insights in our State of QR Code Report!

It’s unfair to compare QR Code performance against industry-agnostic benchmarks. Truth be told, different industries use QR Codes in different ways, and therefore, the CTR varies.
So, here’s your apples-to-apple comparison with others in your industry:
| Industry | Scan-through rate of QR campaign |
| Religious institutions | 2.40% |
| Real estate | 4.80% |
| Retail | 5.80% |
| Art and Entertainment | 6.80% |
| Hospitality | 7.20% |
| Education | 7.40% |
| Health, Wellness and Fitness | 9.20% |
| Apparel and Fashion | 10.10% |
| Beauty | 10.80% |
| Consumer Goods | 12.20% |
| Food and Beverages (FMCG) | 14.90% |
| Events and Services | 18.10% |
| Construction | 24.20% |
| Restaurants | 45.20% |
Let’s discuss a few benchmarks from the table above:
- Restaurant QR Codes garnered maximum scans because, in 2024, that was the safest way to place orders
- Next in line is construction. QR Codes at construction sites in 2024 were replacing physical copies of operations and instruction manuals at sites
- The primary use case of food and beverage brands is adding a QR Code on the packaging to deliver detailed information about the product. They have an average STR of 14.9%, but the well-implemented ones witness STRs as high as 25-30%.
5 Real-world examples of effective QR Code campaigns
1. Hong Kong museum gets engagement rate of 76%
Challenge: M+, Hong Kong’s first-ever museum dedicated to visual culture, saw great success in its QR Code engagement by generating dynamic QR Codes.
Optimization strategies: M+ wanted to use QR Codes to act as a bridge between their physical locations and their digital presence, which they could manage dynamically without changing the print signs.
- The M+ digital team enhanced visitor journeys by deploying dynamic QR Codes at different stages, starting with guest onboarding. This helped track any roadblocks in the visitor journey and address them immediately.
- To break language barriers, they deployed multilingual QR Codes throughout its galleries, providing digital content in multiple languages. Based on your preferred language setting on your mobile device, the QR Code would serve content in the language of your choice, boosting engagement greatly.
🎯Results: Key metrics at a glance
| Total scans | Visitors engaged | No. of QR Codes |
| 148,000 | 113,000 | 42 |
Full story: How M+ gathers 148,000+ content interactions
2. HSBC UK’s bank accounts grew by 52%
Challenge: As part of an initiative, HSBC UK worked with a non-profit called Shelter to promote bank accounts with “no fixed address,” which are targeted at providing better security to the homeless. The aim was to build awareness, open new bank accounts, and attract donors.
🎯Results: Using QR Codes led to a 52% increase in accounts in the campaign’s first two weeks. Though not a primary goal, one in every five QR Code scanners signed up as regular donors, getting over 100 people off the street.
3. New Brunswick tourism’s direct mail campaign gets 1.77% engagement rate
Challenge: To boost the tourism of New Brunswick and create awareness of its offerings.
- Tourism New Brunswick’s team placed QR Codes on direct mail flyers and CTV ads, with the destination landing page enticing scanners to enter a contest to win a trip to New Brunswick and learn more about its offerings.
🎯Results:
The direct mail piece saw an engagement rate of 1.77% with 209 users landing on the main page and 80% of users going on to the contest page.
4. PatientPoint boosted programmatic ad revenue with 270,000+ scans
Challenge: In a post-COVID, no-contact world, healthcare marketing brand PatientPoint needed to revive its programmatic ad revenue.
Optimization strategies: PatientPoints displayed QR Codes across advertising panels at hospitals and clinics, self-checkout stations, and more. Each QR Code displayed programmatic ads of partner brands.
Their team of ambassadors who visit clinics and physicians across the US use digital business cards with QR Codes, which are easy to access and save print costs.
🎯Results: Key metrics at a glance
| Total scans | Visitors engaged | Locations |
| 270,000 | 208,000 | 2,300 |
Full story: How Uniqode was the perfect partner for PatientPoint.
5. Flipkart hits 2M+ scans across TV and print ads
Challenge: Flipkart, one of India’s leading ecommerce players, wanted to boost engagement during their annual Big Billion Days campaign by using QR Codes creatively in their print and TV ads.
Optimization strategies: Flipkart gamified their QR Codes in the print and TV ads, encouraging users to scan and participate in contests.
- They tracked scan-through rates to identify high-performing media placements.
- Flipkart adjusted creative designs mid-campaign to improve their STR by 15%
🎯Results: Key metrics at a glance
| Total scans | Visitors engaged | No of QR Codes |
| 2M+ | 536,000 | 148 |
Full story: How Flipkart “flipped” their QR Code game with Uniqode
How to optimize your QR Code campaign
So far, you have seen where you stand with your QR Code campaigns. Now, let’s say your QR Code campaigns don’t stack up too well against the competition. What are some things you can do to optimize your campaigns? One helpful starting point is applying lead scoring to see which users are more likely to convert.
Understanding where you might be going wrong to answer that is important. Here are a few areas of improvement to draw your attention to:
1. Low scan-through rate
This means your audience is viewing the QR Code without scanning it. The reasons for this could include:
🤔 Reason 1: Lack of a clear CTA
Users don’t know what they will gain by scanning the QR Code, and a missing or vague CTA reduces motivation to engage.
Fix 1: Give users a reason to scan the QR Code
You have been there with email marketing. Unless there are no catchy subject lines, users do not open emails. Similarly, if the incentive to scan the QR Code is not strong enough, users go blind to it.
This incentive is not monetary all the time. It could be emotional, thought-provoking, or personal.
Fix 2: Use the call-to-action frame to communicate the incentive
It’s important to highlight the benefit of scanning the QR Code right below. I have seen multiple instances where the CTA frame reads “Scan me.” This generic text doesn’t do the job.
Keep these QR Code metrics handy. Download your free copy now and unlock the secrets to creating high-performing QR Code campaigns!
Discover how to:
✅ 👓 Free home try-on
✅ 🎁 Earn gift-card
✅ 🤝 Refer and get $10
✅ 🧠 Support mental health
✅ 🧑⚕️ Book a skin session
✅ 💡 Know your skin
✅ 👋 From us to you
✅ 🤝 Thank your farmer
✅ 🍽️ Dinner recipes for tonight
✅ 🚫 Touch | 😷 Stay safe
🤔 Reason 2: Ineffective design
QR Codes that blend into the background, are too small, or use colors that make them hard to scan can reduce your chances of getting scanned.
✅Fix 1: Make the QR Code stand out from the rest of the design to garner more scans
This is more of a design challenge that’s easy to fix. While placing a QR Code, consider two things:
- The position of the QR Code
- The appearance of the QR Code
✅Fix 2: Understanding the science of QR Code placement
Place QR Codes in the first half of the packaging or marketing collateral. This is because users start to read from the top and any action you want them to take subconsciously registers in the brain in the first 10 seconds.
Avoid placing your QR Code in a busy or cluttered area. This automatically develops blindness towards the area.
Use directional cues that point toward the QR Codes. You could use a combination of text and arrow or select a subject that looks towards your QR Code. Psychologically, we tend to look at things as the subject is.
✅Fix 3: Customize colors and add branding to QR Codes
Here are a bunch of things you can do to enhance the appearance of the QR Code:
- Adding color to the QR Code is the easiest way to make it lively. If your QR Code sits amid a busy area, use contrasting colors
- Integrate your brand logo to the QR Code to enhance brand recall and visibility
- Use unique QR Code edges to give your QR Code a character
Have your QR Code big enough to attract eyeballs. While the minimum limit for scanning is 2cm × 2cm, let your QR Code occupy 1/8th of the total size as a rule of thumb.
For detailed solutions to these design issues, see our guide on why QR codes won’t scan and how to fix them
🤔 Reason 3: Lack of trust
Users may not trust the QR Code due to a lack of context or security concerns.
✅Fix 1: Adding your logo is a great way to build confidence with the audience. The trust in the brand will lead to more scans.
✅Fix 2: Use a trusted QR Code platform. There are many QR Code generators on the market, and without the right compliances, such as SOC® 2 or GDPR, you and your customers’ data could be at risk. Look out for these factors when choosing the platform for your campaign.
✅Fix 3: Use a URL preview. A URL preview shows users the destination link or a brief description of the linked content before opening it. It can be either a built-in feature of QR Code scanning apps or additional customization for the QR Code.
2. Low engagement rate
While STR is an excellent measure of the initial stages of the QR Code campaign, if your end goal is sales, one must also pay attention to the engagement rate.
For example, if 50 people scanned the QR Code but only 10 completed the purchase, your engagement rate is 20%. Let’s look at some ways of improving your QR Code engagement rate.
| Metric | Focus | Key questions | Areas of improvement |
| Scan-through rate | Visibility and initial interaction | How many people are scanning the QR Code | Placement, design, CTA, safety |
| Engagement rate | Post-scan effectiveness of the campaign | How many users are taking the desired action? | Landing page design, offer, error-free, load-times etc. |
🤔 Reason 1: Poor landing page experience
Users will naturally abandon the campaign if the landing page is slow to load or if there are any technical errors.
✅Fix: Create a custom landing page
Additionally, ensure it is mobile-friendly, optimized for faster load time, and has a clear and action-oriented CTA.
🔥Pro tip: Build a user journey after the scan The role of an Instagram ad is not just to drive one-time traffic to your website. You also retarget them on Facebook and YouTube to remind them what they love about your product.
The same is valid with QR Codes. While a QR Code is a way to capture one-time interest, a user’s journey should not end there. The ROI of a QR Code campaign doubles when you retarget users who scanned them on various social media platforms.
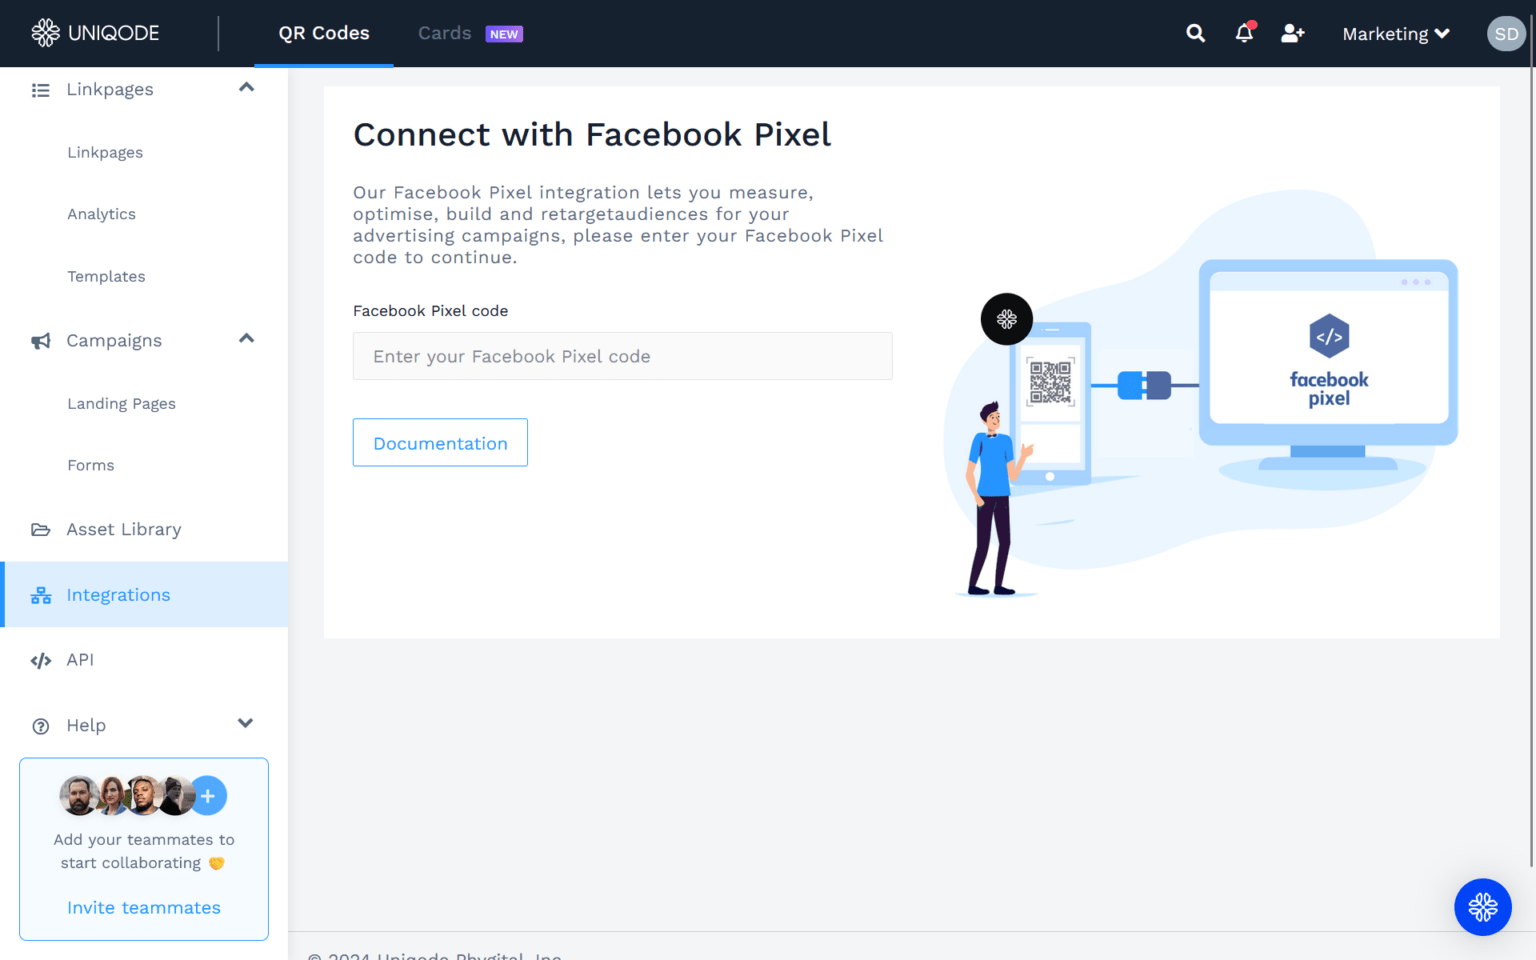
How does retargeting work?
When a user scans a Uniqode QR Code, they are redirected to a mobile-optimized landing page. This webpage stores a cookie on the browser. Later, you can use the same cookie to build retargeting lists for Facebook and Google Ads.
🤔 Reason 2: Overly complicated next steps
If your campaign requires too many steps or doesn’t clearly state what needs to be done, that can be a turn-off for users.
✅Fix: Share instructions about scanning QR Codes
Apps such as Snapchat, Amazon, Google Pay, and Instagram made QR Code scanning a natural habit. But this is not true across generations.
The older generation might still struggle with QR Codes. There are also instances where users are confused about whether they need apps to scan the QR Code.
To handle all such situations, it’s advisable to add a short instruction below the QR Code. Something as straightforward as “Point your phone camera to …..” does the job.
While this is a small change, it significantly impacts the scan rates.
Want to see where you stand? Try our FREE QR Code Campaign Scorecard to benchmark your performance and uncover growth opportunities.
The same is valid with QR Codes. While a QR Code is a way to capture one-time interest, a user’s journey should not end there. The ROI of a QR Code campaign doubles when you retarget users who scanned them on various social media platforms.

Your next steps in creating high-performing QR Code campaigns
Success isn’t by chance. It requires a solid strategy, planning, and execution. Start by:
- Evaluating your current performance: Use our free QR Code Campaign Scorecard👆🏻to assess your current performance and identify growth opportunities.
- Experiment with Advanced Features: Leverage Uniqode’s dynamic QR Codes, advanced analytics, and 1000+ integrations to fine-tune your campaign
- Tracking key metrics: Monitor essential metrics like scan-through, engagement, and conversion rates with Uniqode and Google Analytics integration.
Ektha is a QR code expert with years of research and analysis into the evolution of QR codes. Having written over 70 in-depth articles on QR technology, she has developed a comprehensive understanding of how QR codes are transforming industries. Her insights, including The State of QR Report, have been featured in leading publications. With a passion for simplifying complex topics and providing actionable strategies, Ektha helps businesses leverage QR codes to enhance their ‘phygital’ connections.


